Preparations for this year’s Baja 1000 race are underway.




|
|
Welcome to MarketTrak's S&P 500 Forecast for the Next Trading Day.
Our experimental neural network analyzes market data to generate a trading signal
for the S&P 500 ETF, SPY for the next trading day. This signal is calculated
shortly after the market closes and is typically published here during the
after-hours session, ahead of the futures market reopening.
|
Our forecasts are based on end-of-day market data and an experimental AI model trained to predict the direction of the S&P 500 for the next trading day. While our model aims to provide valuable insights, no model is perfect, and financial markets are subject to numerous surprises. We strongly advise cross-verifying trades with other sources and implementing stop-loss orders to manage risk effectively. Our model moved to a long position for trading on Thursday. Set tight stops. The market remains highly sensitive to oil prices and interest rates. If this page does not look current, try refreshing it by pressing the CTRL and F5 keys. Forecast Model: The neural network model is optimized to maximize the total return over the last two months. The model is experimental and is presented here for information purposes only. Its accuracy, which varies considerably over time, is usually greater than 75 percent based on a moving 60 day average. More details about the neural network model is provided here. Click here for a roadmap of this page. Click here for performance data. Click here for our message board. Follow us on X  Click here for a look at our current neural network model.
Computing the Neural Network Forecasts:
We use an experimental neural network model together with a genetic learning algorithm to
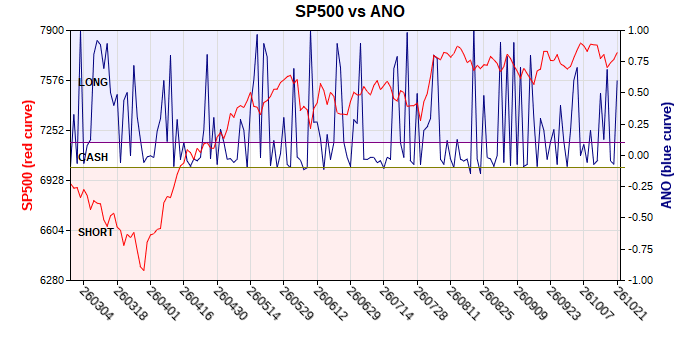
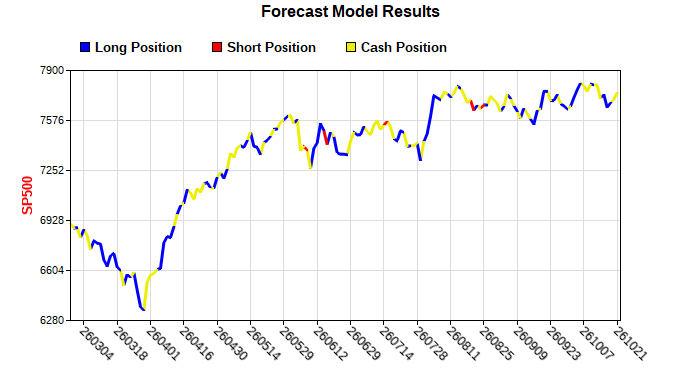
generate and train hundreds of neural networks designed to forecast the next trading day’s closing value of the S&P 500. Model Results: Trading results for the network model covering the last 165 trading days are shown in the two charts below. The vertical grid lines in these charts are 10 trading days apart.
The different color regions in the first chart correspond to the three possible trading positions. The second chart shows the trading positions as determined by the forecast model. Performance Data: Performance of the forecast model is shown in the table below. The results are given for three time periods. The first column of data shows results since the beginning of this calendar year (Y-T-D). The second column of data shows results for the last 165 trading days, and the third column shows results for the last 45 trading days or about the last two months. The drawdown is the maximum drop in any position during the total days shown. The table below and the charts above show blind predictions of the model used at the time. Previous results are not altered to reflect model changes and therefore some of the 165 predictions shown may not represent the behavior of the current model. Page Top
Model Output Data: The table below shows the results of calculations using our neural network forecast model. The data in the table were computed by averaging the results of 200 networks trained on 4200 days of stock market data.
Disclaimer:
Our models are experimental and can change at any time.
You may use our forecast as long as you totally agree with the following
terms and conditions: Our goal is to make our forecast the best
available, but we do not guarantee its accuracy or profitability.
We provide the forecast on an “as is” and “as available” basis
without any warranty of any kind. Specifically, MarketTrak disclaims
any and all warranties, expressed or implied, including without limitation
warranties of merchantability, profitability, and fitness for a particular
purpose. In no event shall you hold MarketTrak liable for any direct,
indirect, incidental, punitive, or consequential damages of any kind
whatsoever. You bear full responsibility for your own investment research
and investment decisions. Nothing in our forecasts should be interpreted
as a recommendation or solicitation to buy or sell any security, or
to take any specific action. The opinions or comments expressed may
change without notice. You determine if and how the forecast is used
in your investments. You recognize that past performance does not indicate
future results. Click here for a
complete disclosure of our disclaimer. Site Links:
|
||||||||||||||||||||||||||||||||||||||||||||||||||||||